Limits with Explanations, Practice Questions, and Answers [AP Calculus, Calculus 101, Math] – Moosmosis
[ad_1]
Calculus: Limits
In this chapter, we will introduce the first big idea in AP Calculus: Limits and Continuity. This a topic that is included in both the AB and BC Calculus courses.
Even if your course hasn’t started yet, a good way to prepare yourself for it is to study limits, as they are generally easy to grasp. This will give you a head start on (most likely) the first topic you will learn in your AP calculus course, and can inhibit you from falling behind.
Let’s get started!

A limit is written in the form

where f(x) is a function. This is read “the limit as x approaches c of f of x.”
Here, c is a constant, but note that it can be infinity or negative infinity as well and would be written as

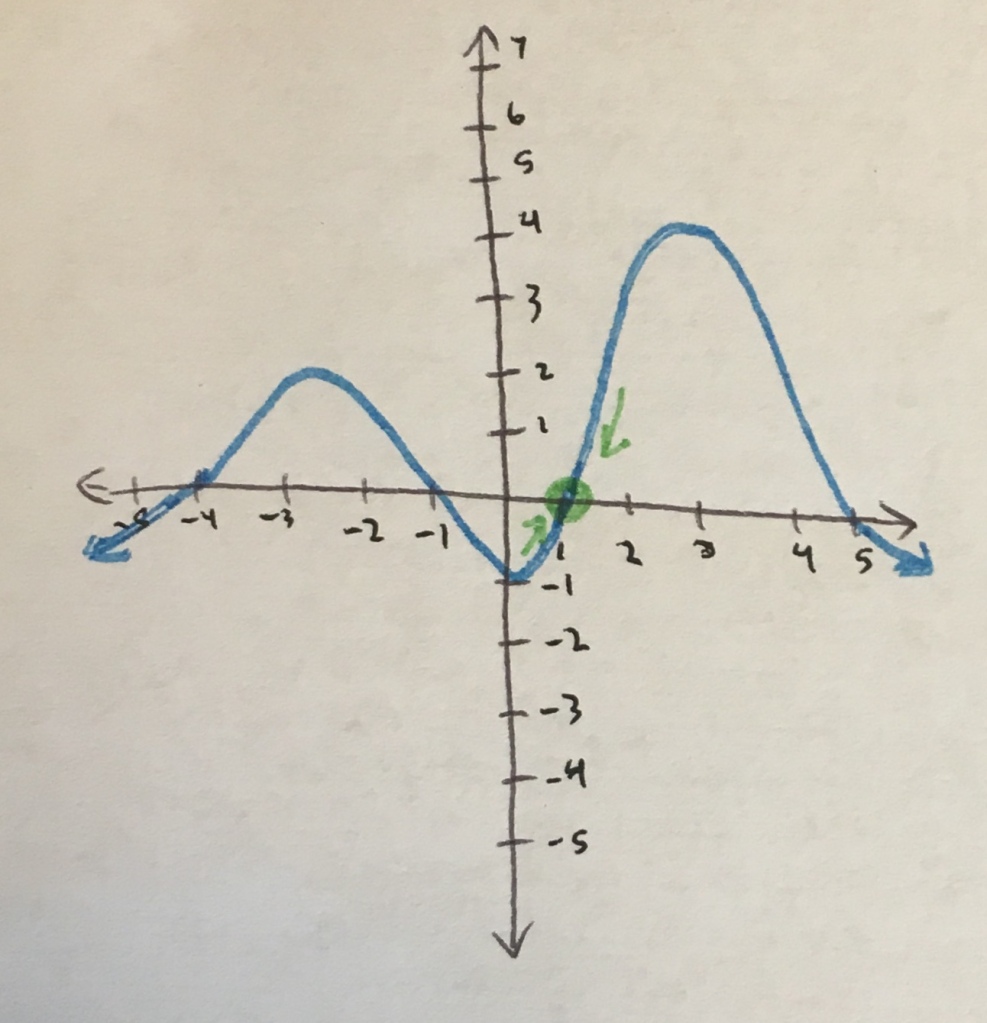
Let’s look at a visual example. In the graph below, the blue graph represents a function. Take a look at the point x = 1 marked in green.

Clearly as the graph approaches x = 1 from both the left and right sides of the point, the function gets closer and closer to the value f(x) = 0.
Since the limit from both sides of the point approach the same value of f, we can write

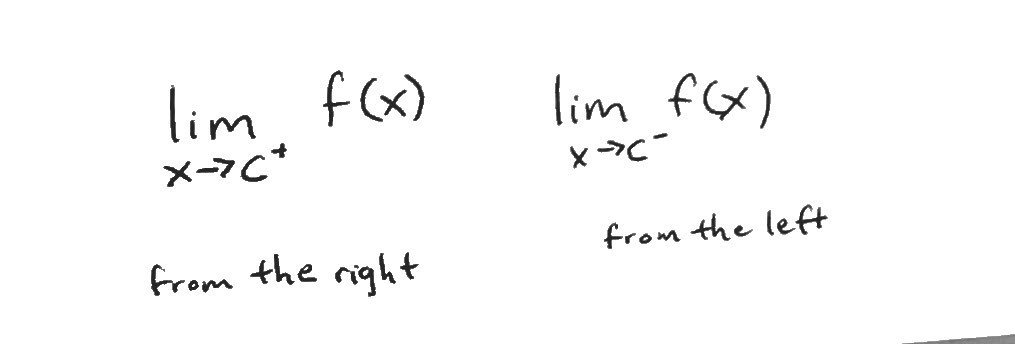
There is also a special way to write the limits from the right and left. These are called one-sided limits and are written as:

Notice that the limit as x approaches f(x) from the right uses a superscript “+” sign next to the c and the limit as x approaches f(x) from the left uses a superscript “-“ sign next to the c.
Knowing that the one-sided limits at a point are defined and equal, we can conclude that the limit as x approaches that value is defined and equal to that same value. Back to the example above, we can write:

This one-sided limit notation may seem useless at first but that’s because we’ve only looked at one example that was… well, simple.
Here’s a harder example.

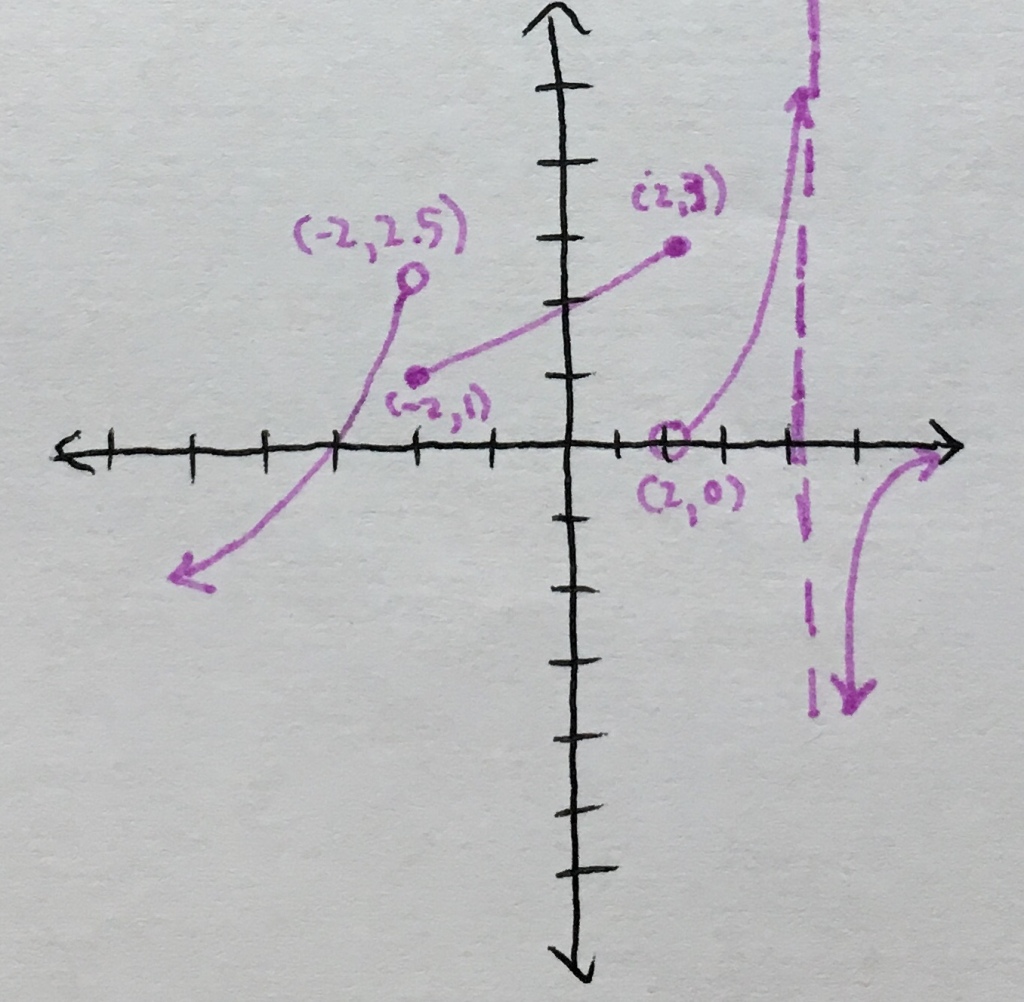
Hmm… this graph looks different from the other one we saw. The first thing we notice is that there are gaps or breaks at x = -2 and x = 2. These are called jump discontinuities. Jump discontinuities occur when both one-sided limits at a point exist but are different.
At x = 2, we have

And since the one-sided limits do not match up, our limit as x approaches 2 does not exist.
Notice that even though the function f(x) never took on the value of 2.5 (as indicated by the open circle at the point), we were still able to express the one-sided limits at the point, as limits denote the value that a function approaches rather than the actual value it takes on.
Similarly, the limit as x approaches x = 2 (another jump discontinuity) does not exist.
At x = 4, something weird happens to our function. The value of f(x) seems to get larger and larger without bound as x approaches 4 from the left and seems to get really negative without bound as x approaches 4 from the right. We call this an infinite discontinuity, which occurs when both one-sided limits approach infinity or negative infinity.
We notate this with:

Next, let’s see how we would identify the limits at points without using a graph.
Let g(x) = 2x + 1. Let’s look at the values of g(x) as x gets very close to 3 from the left. In other words, we are looking for the limit as x approaches 3 of g(x) = 2x + 1 from the left.
| x | g(x) = 2x + 1 |
|---|---|
| 2 | 5 |
| 2.5 | 6 |
| 2.8 | 6.6 |
| 2.9 | 6.8 |
| 2.97 | 6.94 |
| 2.99 | 6.98 |
| 2.999 | 6.998 |
| 2.9999 | 6.9998 |
I think you can figure out what would happen if we continue the table for values of x that are super close to 3. Right! The values of g(x) are approaching 7, so we would expect the values of g(x) to get extremely close to 7.
Similarly, if you looked at a table using values of x that approached 3 from the right, you would see that g(x) gets extremely close to 7.
Thus, we have:

You can check that this is true by graphing g(x) = 2x + 1 or by simply plugging in the value of 3 for x. Either way we get that g(3) = 7 which corroborates our finding of the limit.
However, it is not always true that the limit as x approaches some value c of a function equals the evaluated value of c of that function. In the example above, we did see equality, but this is not always the case. We can only hope to estimate the value of the function at c using the limit, and generally we get a pretty good estimate.
IMPORTANT IDEA:

If it is not clear to you why this is, it will make more sense when we talk about continuity.
In our example above, the limit was equal to the evaluated value at x = 3, because our function was continuous at x = 3.
Limits are very useful tools for evaluating functions, and they are used to a great extent in calculus. Though they seemed pretty easy in this lesson, they can get more challenging and are not always so straight-forward. Sometimes, manipulations are required to find the limit at a point.
Make sure you completely understand the general concept of limits before moving on to more difficult topics as they build upon this big idea.
Works Cited
Popular Calculus Articles
https://www.mathsisfun.com/calculus/limits.html
https://www.mathwarehouse.com/calculus/continuity/what-are-types-of-discontinuities.php
http://tutorial.math.lamar.edu/Classes/CalcI/TheLimit.aspx
https://www.analyzemath.com/calculus/limits/introduction.html
https://www.khanacademy.org/math/ap-calculus-ab/ab-limits-new/ab-1-2/a/limits-intro
Click and check out these popular articles for more information: 🙂
Calculus: Two Important Theorems – The Squeeze Theorem and Intermediate Value Theorem
Calculus: Limits and Continuity
Popular Calculus Articles
Ectoderm vs Endoderm vs Mesoderm
Psychology 101 and the Brain: Stress – Definition, Symptoms, and Health Effects of the Fight-or-Flight Response
Circulatory System: Blood Flow Pathway Through the Heart
Circulatory System: Heart Structures and Functions
Ductus Arteriosus Vs Ductus Venosus Vs Foramen Ovale: Fetal Heart Circulation
Cardiac Arrhythmias: Definition, Types, Symptoms, and Prevention
Upper Vs Lower Respiratory System: Upper vs Lower Respiratory Tract Infections
Seven General Functions of the Respiratory System
Digestive System Anatomy: Diagram, Organs, Structures, and Functions
Kidney Embryology & Development: Easy Lesson
Psychology 101: Crowd Psychology and The Theory of Gustave Le Bon
Introduction to Evolution: Charles Darwin and Alfred Russel Wallace
Symbolism of Shoes in Dreams

Support Us at Moosmosis.org!
Thank you for visiting, and we hope you find our free content helpful! Our site is run 100% by volunteers from around the world. Please help support us by buying us a warm cup of coffee! Many thanks to the kind and generous supporters and donors for doing so! 🙂
Copyright © 2022 Moosmosis Organization: All Rights Reserved
All rights reserved. This essay first published on moosmosis.org or any portion thereof may not be reproduced or used in any manner whatsoever
without the express written permission of the publisher at moosmosis.org.

Please Like and Subscribe to our Email List at moosmosis.org, Facebook, Twitter, Youtube to support our open-access youth education initiatives! 🙂
Categories: calculus, education, math, stem
[ad_2]
Source link


